IP International Journal of Medical Microbiology and Tropical Diseases
Official Publication of Khyati Education and Research Foundation
Official Publication of Khyati Education and Research Foundation
Author Details :
Volume : 5, Issue : 1, Year : 2019
Article Page : 28-33
https://doi.org/10.18231/2581-4761.2019.0007

Abstract
Materials and Methods: This clinical study was conducted on urine and blood samples of chronic HCV patients and healthy individuals that were collected under optimized conditions. Bacteria were isolated and identified using VETIK2 system. Detection of CD56+ and CD3+ levels was performed by Flowcytometry. Alanine/Aspartate amino-transferase (ALT, AST) levels were detected biochemically, enzyme-linked immune-sorbent assay (ELISA) was used for di-acylglycerol acyltransferase-1 (DGAT1) level detection and HCV PCR was performed for viral load detection.
Results: Staphylococcus lentus, Staphylococcus aureus, Klebsiella pneumoniae, Pseudomonas aeruginosa and Eschirechia coli were the common bacterial infections; the slight reduction in CD3+and CD56+ levels that was coincident with increasing the levels of Alt, AST and DGAT1 in patients who suffered from high HCV load.
Conclusion: HCV patients are immune-compromised and suffer from serious secondary bacterial pathogens which increased the severity of HCV infection.
Keywords: Hepatitis C HCV, Lactobacillus acidophilus and Bifidobacterium bifidum, CD3+, CD56+, DGAT1, IFN-? and ribavirin.
Hepatitis C virus is a member of Flaviviridae family, a major human virus that infects approximately >170 million individuals worldwide[1] with impact sever progression.[2] Chronic hepatitis HCV infection is characterized by slow developing to liver cirrhosis, and liver cancer worldwide.[3] In Egypt at >10% of the general population were recorded with the highest epidemic HCV.[4],[5]Transmission of Hepatitis C virus has been tightly associated with intravenous and percutaneous drug and needle use, blood transfusions, hemodialysis patients, tattooing and the role of sexual activity in the transmission of HCV remains unclear.[6] Another severity factor of HCV infection is the seven genotypes of HCV particle with numerous subtypes. These genotypes can differ up to 30% from each other in nucleotide sequence. Depending on the HCV genotype, length of treatment can differ. Genotype 1b is less responsive to alpha-interferon therapy compared to genotypes 2 and 3. Genotype 3 is most common on the Indian subcontinent, while genotype 4 is the most common genotype in Africa and the Middle East.[7] Disease Severity is mainly related to human immunity and how it works against the viral infection as patients with chronic HCV are immunocompromised and may be infected with bacteria as a secondary infection, The most common pathogenic bacteria in patients with chronic HCV were Enterobacteriaceae species, E. coli, and Klebsiella, while the most Gram-positive species bacteria including Staphylococcus aureus [8],[9],[10]Cytotoxic cells CD3- CD56 (+dim) natural killer (NK) against virally infected cells showed that cell-enriched expansion strongly inhibited replication of HCV and HCC.[11] DGAT1 is an enzyme that catalyzes the synthesis of triglycerides and maturation of luminal LD. In active HCV replication, it targets core to lipid droplets LDs and bounded with NS5B[12],[13]while it served as the main host factor for HCV infection.[14] Absence or inhibition of DGAT1 leads to inhibition of viral replication.[15],[16] Additionally, higher levels of serum aspartate aminotransferase (SGOT) and alanine aminotransferase (SGPT) were an indicators for abnormal liver functions.[17]
Patients: The patients with chronic hepatitis C was selected in a mean age of 47±5 years by a specialist physician who selected them free from liver cirrhoses, hepatocellular carcinoma (HCC), HBV, renal impairment and diabetes. The samples were collected in time ranged from October 2013 up to April 2014 at the virology department, El-Obour hospital, Egypt. This clinical study was approved by the ethics committee, Faculty of Medicine, Tanta University. Two groups of Blood and urine samples were collected: Group A control: ten samples were collected from healthy individuals. Group B: twenty samples were collected from patients with chronic hepatitis C before the application of 12 weeks of the treatment protocol using INF-? and ribavirin.
Quantitative RNA PCR assay: It was performed using Artus HCV RG RT- PCR kit (Qiagen GmbH, Qiagen Strasse, Germany) with lower detection limit of 34 IU/ml, automated instrument (HVD Auto Q server).
Media
Nutrient agar [18] Difico Manual ingredients g/l: Peptone: 5.00, NaCl: 5.00, beef extract: 3.00, agar: 20.00, PH was adjusted to 5.0.; Mannitol salt agar (Oxoid product) [19] ingredients g/l: enzymatic digest of casein: 5, beef extract: 1, animal tissue enzymatic digest: 5, D-Mannitol:10, Phenol Red: 0.025, sodium Chloride: 75, agar: 15 Final, pH: 7.4±0.2 at 25º C.; MacConkey Agar (Oxoid product) [20]:Peptone: 20.2, sodium chloride: 5.0, lactose: 10.0, bilesalts:5.0,neutral red:0.075,agar: 12, pH 7.4±0.2 at 25º C.
Gram stain: Crystal violet, Gram's iodine solution, acetone/ethanol (50:50 v: v) and 0.1% basic fuchsin solution; VITEK 2 system (bioMerieux Inc., Hazelwood, MO): VITEK 2 Cards, Suspension Tubes and the Automatic Transport System were used.
CD3+ and CD56+ monoclonal antibodies: (BD Biosciences, SanJose, CA, USA) CD3+ and CD56+ monoclonal antibodies (mAbs) which used for immunophenotype analysis, PBS buffer solution for washing and suspension and RBCs were degraded using lysing BD FACS (Fast Access to Critical Solutions) solution or ACK (Ammonium-Chloride-Potassium) Lysing buffer.
Anticoagulant EDTA tubes for blood collections sterilized Petri dishes and sterilized swabs.
ALT and AST: used reagents (ELITECH) Tris buffer: 125 mmol/L / pH: 7.4, L-Alanine or Aspartate: 680 mmol/l, LDH: 2000 U/L, NADH: 1.1 mmol/L, ?-ketoglutarate: 97mmol/l, IFCC method without pyridoxal phosphate, kinetic. UV; DGAT1: Enzyme-linked Immunosorbent Assay Kit for Diacylglycerol-O-Acyltransferase Homolog 1 (DGAT1). Organism Species: Homo sapiens (Human). This assay has high sensitivity and excellent specificity for detection of DGA T1. Reagents: Pre-coated, ready to use 96-well strip plate, Standard Detection, Reagent A Detection, Reagent B, TMB Substrate, WashBuffer (30×concentrate), sealer for 96wells Standard Diluent, Assay Diluent A, Assay Diluent B, Stop Solution.
Real time polymerase chain reaction (PCR) HCV assay
The investigated blood samples were processed using automated instrument (HVD Auto Q server) at the virology lab, El-Obour hospital, Kafr El-sheikh to check the quantitative RNA copies per milliliter of blood plasma while viral load often correlates with the severity of an active viral infection [21].
Isolation and counting of bacteria:[22] Isolation of bacteria from urine samples was performed on nutrient agar that was inoculated with 100 µl of urine sample then incubated for 18-24 hours at 37ºC. The obtained bacterial isolates were investigated by Gram reaction. Subsequently, G+ve bacteria were subcultured on Mannitol salt agar while, G-ve bacteria were grown on MacConkey agar. Bacterial counts in the investigated samples were determined according to the following equation: CFU/ML = (no. of colonies x dilution factor) / volume of culture plate. Dilution factor was zero as there was no dilution was performed.
Identification of bacteria: BioMerieux[23] VITEK® 2 systems version: 06.01 was used for identification of isolated bacteria while 64 identification tests were processed, as enzyme hydrolysis acidification, alkalinization and growth under inhibition conditions like lactase, oxidase test. Transfer a sufficient number of pure colonies in 3.0 ml of sterile saline (aqueous 0.45% to 0.50% NaCl, pH 4.5 to 7.0). then, the suspended bacterial cells were placed into a special rack (cassette) and the identification card was placed in the contiguous slot then moved to the optical system where readings were observed and data were collected at each 15-minute.
Detection of CD3+ and CD56+ cells count: Flow cytometric analysis: [24] Fresh venous blood samples were collected on EDTA tubes for identification of CD3+, CD56+ cells. On brief, fresh blood about 100 µl were transferred into staining tubes which was stained by human mAbs, using recommended concentrations by the manufactures. Incubation of the stained tubes for 20 minutes in particular cold and dark conditions, and then RBCs were lysed by adding ACK lysing solution (1x) or BD FACS for 15 minutes then 5 minutes centrifugation at 1250 rpm, supernatant contained lysed RBCs was discarded. PBS buffer solution was added for washing to complete removing for any debris or RBCs and for re-suspend the pellet too, acquisition was by FACS Calibur or FACS Canto II (BD Biosciences, SanJose, CA, USA). FACSDiva, CellQuest (BD Biosciences) and data were analysed by Flowjo software.
Biochemical measurements of ALT and AST[25] (Bruns et al., 1981)
International federation of clinical chemistry and laboratory medicine (IFCC) method without pyridoxal phosphate, kinetic UV., adjust the wave length at 340 nm, add sample volume of 20 µL to reagent volume 200 µL and incubate at temperature 37ºc, The set tubes mixed and the absorbance of the sample was measured after 50, 120 and 180 seconds. The mean absorbance change per minute was determined. Calculations were achieved by using the equation U/L=1746 x A /min, while Reference values: - Men: - ? 45, Women: - ? 45.
DGAT1 enzyme ELISA:[26] Prepare all reagents, samples and standards; Add 100 ?L standard or sample to each well. Incubate 2 hours at 37oC. Aspirate and add 100 ?L prepared Detection Reagent A. Incubate 1 hour at 37oC, Aspirate and wash 3 times. Add 100 ?L prepared Detection Reagent B. Incubate 30 minutes at 37oC. Aspirate and wash 5 times. Add 90 ?L Substrate Solution. Incubate 15-25 minutes at 37oC. Add 50?L Stop Solution. Read at 450 nm immediately.
Statistical analysis
The data of present study were conducted using the mean, standard deviation, Chi-square test by SPSS V.20. Standard student "t test" test of significance of the differences between means *P? 0.05, **P? 0.01.These clinical data were recorded and analyzed along the study for each patient.
Viral load of Hepatitis C
Viral load of healthy individuals (group A) was zero which is negative result as they are healthy individuals but its load in patients with chronic hepatitis C (group B) was a highly positive load. Subsequently, their susceptibility to the secondary bacterial infections increased (Table 1).
Isolated pathogenic bacteria and its load associated with chronic HCV infection
The microscopic investigation of Gram reaction revealed the presence of all G+ve bacterial isolates in coccoid form especially staphylococci, while G-ve isolates were bacilli. The secondary bacterial infection in patients with chronic HCV (group B) was compared to that in healthy people (group A). It was found that investigated patients with chronic HCV who infected with both G+ve and G-ve bacteria were 30% and who infected with only G+ve bacteria were 37.5% and others infected with only G-ve were 7.5%. Number of chronic HCV patients who revealed no bacterial infections were 25%. Moreover, the load of isolated Gram positive bacteria (75%) on Mannitol medium was more than the Gram negative load on MacConkey (25%).
The Identified pathogenic bacteria associated with chronic HCV infection by VITEK 2 System
It was found that Eschirechia coli, Staphylococcus lentus, Pseudomonas aeruginosa, Staphylococcus aureus, Klebsiella pneumonia were five common bacterial pathogens which were identified by VITEK 2 system in patients with chronic HCV.
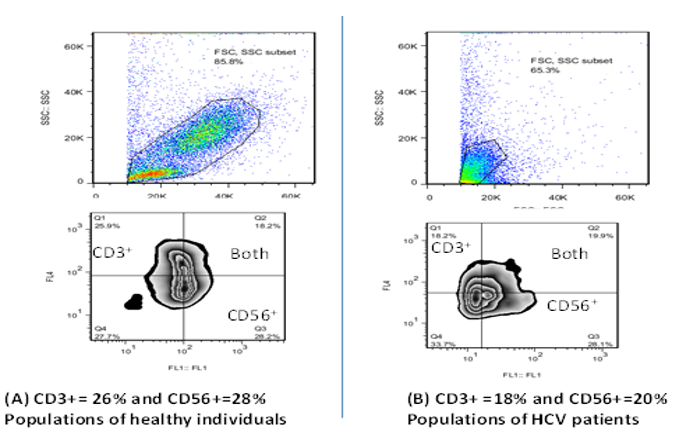
Reduction of CD3+ and CD56+ cells populations in HCV infection.
It was found that populations of CD3+ and CD56+ in healthy individuals (group A) were more than their populations in patients with chronic hepatitis c (group B) who infected with high viral load and this another evidence of being patients immunocompromised that due to viral infection (Table 2 (A,B) and Fig. 1 (A,B))
Induction of ALT and AST enzyme levels: They increased as a result of chronic HCV infection (Table 3).
DGAT1 enzyme level increased in patients with chronic HCV: it increased compared to its level in healthy individuals as a result of the viral infection (Table 4).
Table1. PCR results of HCV patients
|
Patient's code number |
Sex |
Age/ years |
PCR result IU/ml |
|
p1 |
F |
48 |
23,030,498 |
|
p2 |
M |
43 |
1,005,317 |
|
p3 |
M |
45 |
1,016,250 |
|
p4 |
M |
44 |
1,581,138 |
|
p5 |
M |
56 |
1,787,737 |
|
p6 |
M |
50 |
804,704 |
|
p7 |
M |
48 |
199,35 |
|
p8 |
F |
53 |
214,933 |
|
p9 |
M |
50 |
367,821 |
|
p10 |
M |
45 |
138,772 |
|
p11 |
M |
50 |
193,035 |
|
p12 |
F |
48 |
7,684 |
|
p13 |
M |
45 |
13,561,362 |
|
p14 |
M |
55 |
23,207 |
|
p15 |
F |
45 |
1,190,245 |
|
p16 |
F |
43 |
170,727 |
|
p17 |
M |
40 |
711,710 |
|
p18 |
F |
53 |
1,356,13 |
|
p19 |
M |
52 |
1,250,23 |
|
p20 |
F |
50 |
1,150,13 |
M=Male, F=Female. P1 = patient number 1
Table 2: cell counts of CD3+ and CD56+ in both healthy individuals (group A, n=10) and patients with chronic HCV (group B, n=15).
A: Populations of CD3+ in healthy individuals and patients with chronic HCV
|
CD 3 + |
Group A |
Group B |
|
Range |
18 – 27 |
12 – 25 |
|
Mean + SD |
23.0 + 4.58 |
18.53 + 4.26 |
|
t. test |
2.699 |
|
|
P. value |
0.120 |
|
P.value=0.01-0.05 showed significant result, gpB=chronic HCV patients. As shown slightly increased the populations of CD3+ (gpA) than gpB that introduced by Mean + SD.
B: Populations of CD56+ in healthy individuals and in chronic HCV patients
|
CD 56+ |
Group A |
Group B |
|
Range |
24 – 36 |
22 – 38 |
|
Mean + SD |
30 + 6.11 |
29.0 + 4.06 |
|
t. test |
0.002 |
|
|
P. value |
0.962 |
|
P.value=0.01-0.05 showed significant result, gpB= chronic HCV patients. As shown a slightly high of the populations of CD56+(gpA than gpB) that introduced by Mean + SD
Table 3: liver enzymes SGPT, SGOT levels in both group A and group B:
|
Enzyme/IU/ML |
SGPT |
SGOT |
||
|
Gp A |
Gp B |
Gp A |
Gp B |
|
|
Range |
15.00- 25.00 |
19.00 – 90.00 |
15.20 – 28.00 |
23.00- 84.00 |
|
Mean + SD |
17.80+ 3.08 |
49.00 + 19.74 |
19.83 + 3.55 |
49.76 + 17.04 |
|
t. test |
24.246 |
29.644 |
||
|
P. value |
0.001* |
0.001* |
||
P.value * = significant result 0.001*
Table 4:DGAT1 levels in both healthy individuals (group A) and patients with chronic HCV (group B).
|
DGAT1 IU/ML Before |
Group A |
Group B |
|
Range |
68.9 – 1011 |
42.3 – 1819 |
|
Mean + SD |
302.1 + 264.2 |
528.4 + 438.7 |
|
t. test |
2.214 |
|
|
P. value |
0.148 |
|
DGAT1 (diacylglycerol acyltransferase-1), P.value=0.01-0.05 showed significant result, gpB=chronic HCV patients, gp A (healthy individual)
 |
Click here to view |
Fig. 1: (A,B) analysis of CD3+ and CD56+ counts (Flow Jo software) in healthy individuals are more than that in HCV patients.
This clinical study demonstrated that the most common secondary bacterial infection associated with HCV infection
especially chronic hepatitis C were Staphyllococus spp. in Egypt where genotype 3 and 4 which are dominant. Bacterial load of G+ve on Mannitol medium (75%) was more than that of G-ve on MacConkey (25%). The identification by VITEK 2 system as a precise automated technique was used to identify the isolated pathogens and the results revealed the presence of S. lentus, S. aureus, K. pneumoniae, P. aeruginosa, E. coli. Moreover, the group of healthy people showed no bacterial growth. Those obtained by14-16 Carrion et al. (2009), Jalan et al. (2014) and Kawano et al. (2015) that E. coli, Klebsiella, and Enterobacteriaceae species were the most common pathogenic bacteria in patients with chronic hepatitis C
which was called secondary bacterial infections and recently, Gram-positive bacteria including S. aureus.
Subsequently, hepatitis C patient is one of the immunocompromised patients while viral infection followed by several symptoms by time related to infection severity and development of the disease while it began as acute infection then chronic infection, fibroses, cirrhosis and developed to hepatocellular carcinoma that followed by death.[27] biochemical changes had been occurred as a result of these stages like decreasing of albumin, respiration difficulties, digestion disorders, increasing of liver enzymes, liver dysfunction, diarrhea, immune dysfunction.[28]The side effects of several HCV medications strategies and others related to secondary bacterial infections.[15] According to current study, reduction of CD3+ and CD56+ levels and increased levels of liver enzymes ALT and AST act as other evidences of immune commpromisation and liver dysfunction during HCV infections.
DGAT1 enzyme is involved in lipoprotein coat structure of HCV particle which protects the virus so it can escape from the immune defense. There is a balance between the amount of core on lipid droplet (LD) surface and virus production.[29] However, recent reports showed a critical involvement of lipid droplets (LDs) in infectious virion production, and viral budding requires the lipoprotein secretion pathway. This active process is mediated by the interaction between the diacylglycerol acyltransferase-1 (DGAT-1) and HCV core.[30] Both RNA replication and infectious particle assembly are thought to take place at ER membranes,[31] and these previous studies support the current study result, while DGAT1 enzyme level in chronic HCV Egyptian patients was increased by HCV infection in a comparison to its level in healthy individuals in Egypt where genotype 3,4 and this new evidence proved that previous evidences which were performed outside Egypt provided DGAT1 enzyme as a Key of HCV infection.
The levels of DGAT1 enzyme, ALT, AST, CD3+ and CD56+could be used as indicators for development of HCV infection. Bacterial infections especially Staphylococcus spp are associated with hepatitis C viral infection in Egypt. Moreover, a light spot on the importance of finding new HCV treatment strategy that provides both antibacterial and antiviral responses. DGAT1enzyme may play a role in development of new antiviral treatment as it plays a role in HCV infection.
Conflicts of Interest: None.
How to cite : Allam N G, Salem M L, Batae H E, Nabieh M M, Secondary bacterial infections and responses of CD56+ CD3+ and DGAT1 in chronic HCV patients. IP Int J Med Microbiol Trop Dis 2019;5(1):28-33
This is an Open Access (OA) journal, and articles are distributed under the terms of the Creative Commons Attribution-NonCommercial-ShareAlike 4.0 License, which allows others to remix, tweak, and build upon the work non-commercially, as long as appropriate credit is given and the new creations are licensed under the identical terms.
![]()
![]()
Viewed: 2081
PDF Downloaded: 576